In The News
February 2014 Syleconomics - Best start to a new freight year ... ever!
The February 2014 business figures showing amazing pricing data! The freight market is hot!
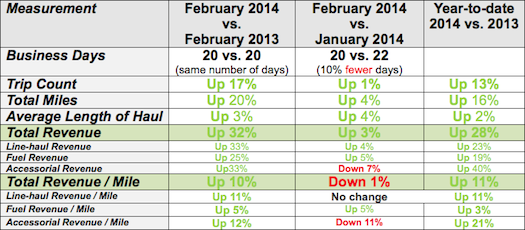
February 2014 vs. February 2013: Wow! February 2014, on the heels of a great January and December, February 2014 continued the momentum! February 2014 had the same number of business days as February 2013, and managed a whopping 32% revenue jump over the same period last year with only a 17% increase in loads. So February actually saw a significant increase in rates. February 2014 saw a continuation of the severe weather situations that began in December. Blizzards, extreme cold and other weather related factors affected capacity and schedules, which put a strain on available drivers/trucks and upward pressure on prices. Also, unlike early 2013, no fiscal cliff issues (like last year) and a strong stock market reflecting better corporate earnings. This is, by far, the strongest February we have recorded which follows on the heels of one of the strongest January-Decembers we have ever recorded. Companies usually look to come out of the first quarter with “break even†or “minor lossesâ€. We suspect that many companies exited February with their greatest start to the year. What is very exciting is that February’s revenue per mile set another all-time high, and the majority of that increase is in line-haul (fuel remained stable and accessorial actually declined January to February). All in all, it continues to be a great way to start 2014!
With all this great revenue data, one would think that trucking companies would be very wealthy. However, all trucking company owners know that their costs continue to rise and their rates have not followed suit until recently.
How about capacity? At our annual conference in early February, many customers mentioned to me that they were running out of trucks and drivers. So the capacity crunch is still on. Capacity numbers are showing a relative stability but we have yet to reach 2007 levels. Trucking is now in a traditional “slow period†(January through to early March), so the lean capacity number combined with the weather-related impact on demand has spiked prices. See charts below for more information. Good news—this is the 9th month in a row where we see year-over-year revenue growth and volume. We started 2014 much stronger than we ended 2013 after stagnant or no growth for the first half of 2013.
February 2014 versus January 2014: February 2014 had two fewer (10 percent less) business days compared to January 2014, so the business increase of 3% shown in the tables below should really be more like a 10-12% increase if adjusted for business days. February is usually a slower month and after adjusting for business days, makes it very strong compared to the strong January. What is really impressive is how the rate-per-mile has jumped in February – the best rate-per-mile on record since we started recording 8 years ago.
The year-to-date figures (to start off 2014) show the fact that 2014 has had such a great, record start. Total revenues up 28% with business volumes up 13% and rate/mile values all showing strong increases. The most important rate, the line-haul rate/mile is up 11% this year vs. last year. The question is will this rate increase continue or stabilize? Right now, anyone with capacity and is a quality carrier has an advantage when it comes to pricing.
Capacity is continues to lag and has still not reached 2007 levels. Lower capacity will put continued stress on rate per mile.
Truck Searches and Load Postings: Both charts show a healthy growth in 2014. The load posting has had a surprising start for the first month of 2014 and continued strong in February. Again this is reflecting the capacity crunch as companies look for creative ways to cover excess freight.
Below, is a breakdown of the metrics: (Note: To be included in the data analysis, companies had to be on our system for all reporting periods – consider this the “same store†concept)
Breakout of Revenue by Type:
Below, is the breakout by percentage of revenue.

Line-haul revenue represents 76.5% of the total revenue
Fuel revenue represents 11.0% of the total revenue
Accessorial revenue represents 12.5% of the total revenue
About Sylectus
Sylectus is trucking’s most powerful network. Born in the new, cloud-based economy, it’s built on one simple idea … leverage the resources of your competitors to achieve extraordinary results for your customers and for your company. Sylectus is more than Transportation Management Software. It’s a web-based, protected, wealth creation network for managing in the New Trucking Economy. Designed exclusively for progressive trucking companies,Sylectus enables them to bypass the investment and time continuum to grow fast NOW.