


In The News
The Impact of Hurricane Sandy on Transportation
After it subsided about a week ago, the impact of Hurricane Sandy is slowly starting to impact the North American transportation markets. If history repeats itself, there will be a potential near-term, six-to-ten week increase in rates (due to capacity constraints) for most members of the Sylectus Alliance.
As services (electricity, water, roads, etc.) are restored in the Eastern part of the continent, factories will reopen and freight activity will resume in affected areas. Several of our alliance members in the storm affected areas have reported this is the worst devastation they have ever seen. Many have resumed operations, but low fuel supplies, storm debris and damaged infrastructure are still impacting their ability to operate at 100%. We expect truckload, expedite and flatbed capacity will tighten, particularly in the Northeast and parts of the Midwest due to:
· Emergency supplies being shipped into damaged areas (medical supplies, food supplies, etc.)
· Replenishment of depleted store inventories (remember that most grocery stores only maintain3-4 days of inventory)
· Rebuilding supplies and equipment are directed to the damaged areas.
This “one-time†event will be compounded by the seasonal holiday surge of November and early December. Sylectus Alliance members will enjoy a period where they can reach into the deep, flexible resources (truck capacity) of the Alliance to secure more of this business at a better-than-normal rate.
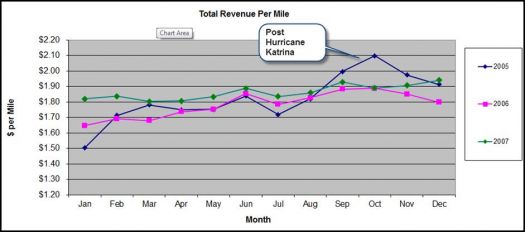
Why? If we review what happened following Hurricane Katrina in August of 2005, there was an immediate call to ship emergency supplies, materials and equipment into the storm ravaged south (we are already seeing some of this Hurricane Sandy relief effort now). This left the north with reduced capacity and within a few weeks, rates increased (supply-demand) as shippers in the north scrambled to find sufficient capacity to move their goods. The rate increase was only temporary, lasting no more than a few months. Below are “rate per mile†charges for 2005, 2006 and 2007 by month. It clearly shows the impact on rates shortly after Hurricane Katrina in August 2005 that lasted for about 3 months.
Total Revenue per Mile (includes line-haul, accessorial and fuel surcharge):
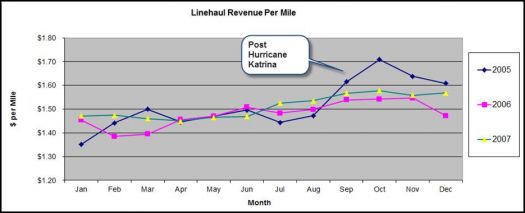
If we break out just the “line-haul†we see an even more pronounced rate impact:
If we break out just the “line-haul†we see an even more pronounced rate impact:
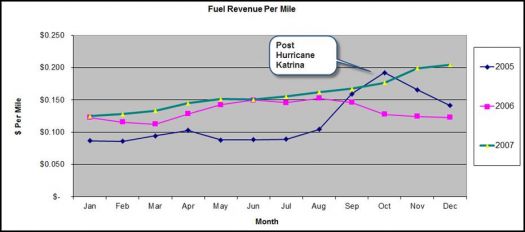
And the “fuel rate/mile†was also impacted due to the refineries that were taken offline in the gulf coast. We likely will not see a similar spike this time.
Another lesson we learned from Hurricane Katrina was the government officials confiscating equipment that went into the damaged areas. Trucking companies servicing the damaged areas suddenly lost some of their own capacity as FEMA kept the equipment in the south for emergency services. FEMA paid for the use of the equipment, however, the capacity that would normally serve existing shippers became unavailable.
What can you do to position yourself properly over the next 6 to 10 weeks?
1.Make sure your available equipment is constantly and accurately posted on the Alliance network. We know there will be a spike in “truck searches†done on the network, so keeping your equipment posted will increase the likelihood of getting more business.
2.Monitor the “posted loads†on the system for good opportunities. There has already been a spike in terms of posted loads on the system.
3. Be prepared to say “yes†to new opportunities. As capacity tightens, more shippers will be looking for trucking companies that can service their needs. Now is the time to leverage the 11,000+ fleet in the Sylectus Alliance to your advantage to lock in more new business.
4. Treat your existing customers properly. Now would be a good time to explain that you will treat them the same, even though capacity is tight. In return, you expect the same treatment in the future should capacity be plentiful.
5. Sylectus cannot and will not suggest any rate structures to charge. That is your responsibility based on market conditions. All we can do is provide you with some historical perspective. Set your rates wisely.
6. You can earn some “good neighbor†points with other members by offering emergency services and supplies. Some of our Alliance members in the storm-affected areas may need your assistance to get back on their feet. We already had one of our members offer industrial strength generators.
While we anticipate the storm will largely impact the next 6-10 weeks, business will eventually return to normal. It is possible that prolonged weather-related network disruption and capacity shortages could have modest favorable implications on both spot and contractual rates into 2013.
The wise trucking executive will read and use this information to improve their business.
Now … the charts!
Supply/Demand analysis
2011 was the best year ever for many Sylectus customers and 2012 so far is surpassing 2011. We see a particularly strong increase in our long-term customer base (customers with us for at least 5 years). The long-term customers have such a strong, well-established, trusted network within the Sylectus Alliance, that they have been able to leverage the Alliance capacity into higher business volumes.
Our SUPPLY-DEMAND index (below) is comprised of a subset of our customers that have been on our system for a minimum of 6 years.
The BLUE line is the normalized load count (DEMAND) and the GREEN line is the normalized fleet count (SUPPLY) for the companies in the index. The RED line is the DOW JONES INDEX normalized the same way as the DEMAND and SUPPLY chart.
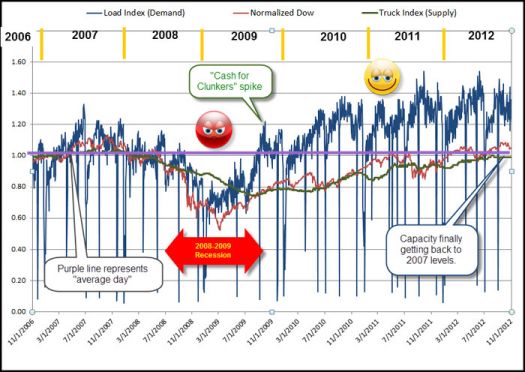
What is driving this success of our customers is not a strong, rebounding economy, but rather a continued and prolonged shortage of capacity.
Chart Analysis:
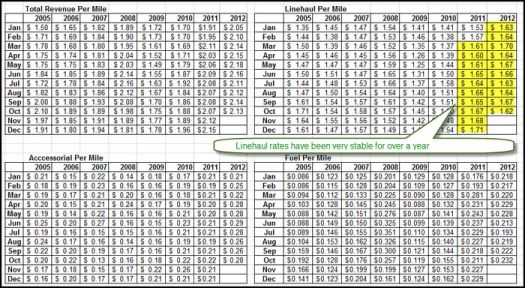
If you look at the table below … you will see that Line-haul revenue per mile in 2008 was in the $1.50 to $1.60 per mile. In 2009 the Line-haul revenue per mile has slipped as low as $1.25 before rebounding to the mid $1.40 range. 2011 rebounded and ended the year nicely, and 2012 has continued the good rate structures of 2011, even surpassing the 2008 high months that were affected by the high price of fuel. We have seen very stable line-haul rates now for over a year.
The following data / chart shows 2005, 2006, 2007, 2008, 2009, 2010, 2011 and 2012 in terms of total revenue per mile, line-haul revenue per mile, accessorial revenue per mile and fuel revenue per mile.
Total revenue per mile is a combination of
· Line-haul revenue per mile,
· Accessorial revenue per mile and
· Fuel revenue per mile.
About Sylectus
Sylectus is trucking’s most powerful network. Born in the new, cloud-based economy, it’s built on one simple idea … leverage the resources of your competitors to achieve extraordinary results for your customers and for your company. Sylectus is more than Transportation Management Software. It’s a web-based, protected, wealth creation network for managing in the New Trucking Economy. Designed exclusively for progressive trucking companies, Sylectus enables them to bypass the investment and time continuum to grow fast NOW.
website: www.sylectus.com